BJP's petrol graph gets massively trolled
Monday, September 10, 2018 • Telugu


Listen to article
--:-- / --:--
1x

This is a beta feature and we would love to hear your feedback?
Send us your feedback to audioarticles@vaarta.com
Send us your feedback to audioarticles@vaarta.com


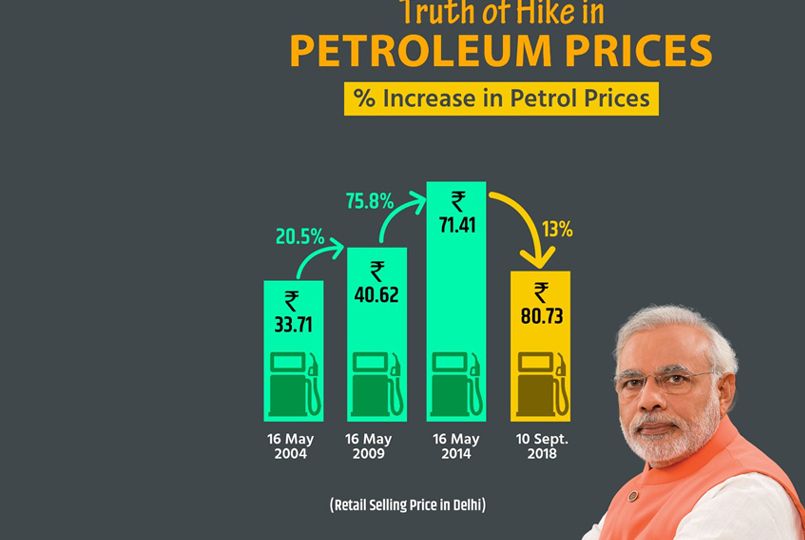
On a day when many opposition parties supported a Bharat Bandh across the country to raise a voice of protest against fuel prices, the ruling BJP put out a graph detailing the rise in fuel prices under the UPA regime. The saffron party compared it with the hike during the Modi years.
Between 2009 and 2014, the party says, the price of petrol rose by a whopping 71.41 percent. On the other hand, since Modi became the Prime Minister, it rose only by 13 percent. In percentage terms, NDA is better, it wants to say.
However, the message of the graph has been lost on many. While the graph talks about the percentage hike, many are deeming that it's talking about the absolute numbers and wondering how on Earth can any sensible person say that the price has actually come down.
The graph is improperly done. It's confusing although its message is understandable.
Follow us on Google News and stay updated with the latest!
 Follow


More News


Headlines